
India’s big cities measure air more often and more precisely. Networks of stations now stream hourly readings. Dashboards convert them into an AQI, a scale that ranks health risk from good to severe. The data helps officials plan traffic curbs and construction bans. It also gives businesses and schools a clearer way to plan their day.
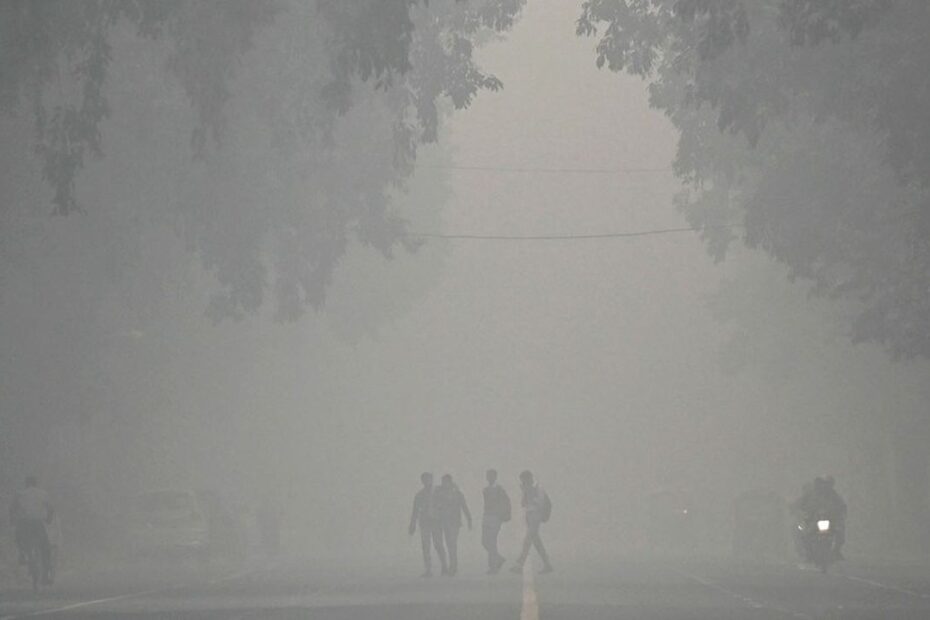
Air quality in Indian cities under closer watch
Urban monitors track PM2.5 and PM10, which are tiny particles that travel deep into the lungs. Stations also report NO₂, SO₂, CO, and ozone. Many sites now run continuous analysers. Some plants use CEMS, devices that measure stack emissions in real time. The national standard, called NAAQS, sets the limits each pollutant should not exceed over specific periods. Cities compare their readings with these targets to judge progress.
Coverage has improved. Metros and state capitals run dense networks. Tier-2 cities are adding sites, often with low-cost sensors that fill spatial gaps. Validation remains vital. Authorities cross-check new sensors with reference-grade instruments to avoid false alarms. Public portals now show uptime, calibration status, and station metadata. That builds trust in the numbers.
What recent data tends to show
Seasonality drives large swings. Winter inversions trap pollution close to the ground, so PM spikes after still, cold nights. Crop-residue burning and fireworks add short, sharp peaks. Summer brings stronger winds and better dispersion. Monsoon rain scrubs the air. Industrial belts and busy corridors see higher baselines year-round, especially near diesel traffic and construction zones. Clean-fuel shifts in households and vehicles help in pockets, yet gains can fade when weather turns adverse.
Short-term curbs can work. Triggers that limit dust at sites, pause demolition, or raise parking fees reduce peaks during episodes. Cleaner buses and last-mile freight pilots support steady improvement. The data shows that structural moves—fuel quality, vehicle standards, and better power dispatch—hold the most lasting effect.
Why compliance still lags
Compliance means more than hitting a daily AQI goal. It requires meeting annual NAAQS levels across all stations. Many cities still exceed PM2.5 limits on a yearly basis. Fast growth adds traffic and construction. Enforcement varies by state. Some permits lack tight monitoring clauses. Data gaps persist when stations go offline. Budget cycles also slow repairs and calibration.
Governance complexity adds friction. Air sheds stretch across state borders. A city can act, yet emissions drift from outside. Industrial relocation pushes sources to the periphery, not away. Clear roles across municipal, state, and regional bodies reduce overlap and delay.
What works for cities right now
First, maintain the network. Publish uptime and repair timelines. Make calibration logs public. Second, manage dust. Cover materials in transit. Enforce wheel-wash and site sprinkling. Audit compliance with photo logs. Third, fix traffic flow. Retime signals, clear choke points, and improve bus priority. Fourth, electrify where it is easiest. Two- and three-wheel fleets offer quick wins with the right charging plan. Fifth, tighten industrial controls. Verify CEMS data, not just paper reports. Link penalties to verified exceedances.
Public communication matters. Alert systems should use simple language and thresholds. Schools and clinics need advice tailored to children and seniors. Clear indoor tips—close windows during peaks, run basic filtration where feasible—protect health without panic.
How companies can respond
Firms can track site-level exposure using AQI feeds near plants and offices. Logistics teams plan around episode days to avoid idling queues. Construction contractors must budget for dust control from day one. Employers protect staff with indoor air checks and maintenance of HVAC filters. Procurement teams can ask suppliers for emissions-control proof, starting with high-risk sectors like brick kilns, stone crushing, and diesel fleets.
Policy tools to watch next
City action plans should align with regional air-shed plans. Stable funding for operations and maintenance makes networks reliable. Open APIs enable researchers to spot anomalies and guide audits. Programmes that reward verified reductions—such as market-style clean-air credits—could target dust and diesel sources. Better crop-residue management and cleaner generators cut seasonal peaks. Finally, transparent evaluations of flagship schemes keep attention on measurable results rather than announcements.
A practical reading of the road ahead
Monitoring is stronger, and public awareness is high. Yet annual PM goals remain hard in many places. The path forward is clear. Keep the data flows clean. Focus on the heavy hitters—dust, diesel, inefficient stacks. Align city moves with regional plans. When monitoring drives targeted action, Indian cities can lock in cleaner air through every season.